Spotting the Gaps: Effective Monitoring of Log Flow in Splunk

Ensuring the reliability and completeness of log data in Splunk is essential for maintaining a robust security posture. Our solution focuses on monitoring the flow of logs into Splunk and identifying issues such as missing or delayed entries.
By detecting these anomalies, Security Operations Centers can swiftly respond to potential threats and maintain effective incident response.
Monitoring log flow is also critical for regulatory compliance and forensic investigations, as it ensures that all system activities are accurately and reliably recorded. Without a comprehensive monitoring solution, organizations risk undetected breaches and compromised security.
Tracking Log Sources in Splunk with a KV Store
Our approach involves using a Splunk KV store (critical_indexes_kv) to track critical log sources. This store maintains information on last event times, index times, and predefined thresholds for each log source. It also includes a suppression feature, allowing users to ignore certain alerts temporarily.
The KV store tracks log sources based on combinations of host, index, source, and sourcetype, offering flexible criteria through wildcard definitions.
Additional fields include a suppression toggle and delay and index thresholds, measured in minutes. An owner field also enables targeted notifications for responsible parties to ensure log integrity.

In this example, a combination of index and sourcetype is used as log source criteria
Dynamically Constructing Queries to Update Log Sources
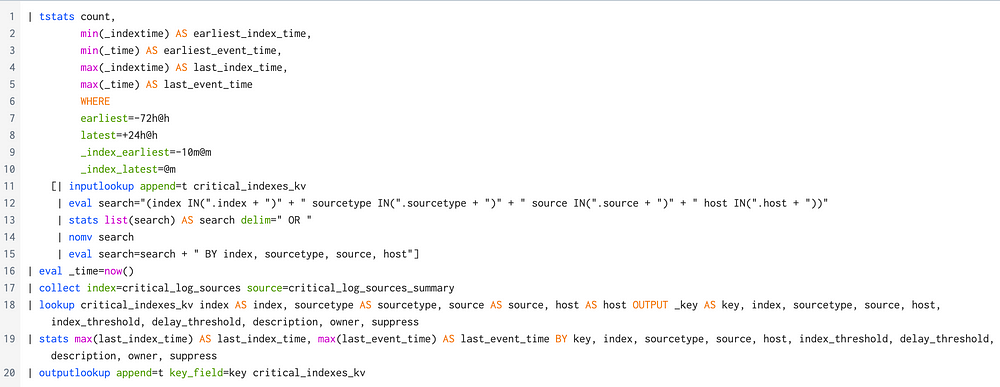
The Splunk search shown below dynamically constructs queries based on values from the critical_indexes_kv lookup table, tailoring each query to specific criteria such as host, index, source, and sourcetype defined in the table.
It utilizes tstats to efficiently perform statistical operations on indexed fields, which provides faster performance compared to traditional searches, especially when dealing with large datasets.
The search first calculates statistics such as the earliest and latest index times and event times for the specified criteria:
• Event Time: The timestamp when the actual event occurred.
• Index Time: The timestamp when the event was indexed into Splunk.
Understanding the difference between event time and index time in Splunk can highlight delays in log processing and indexing. For more insights on this topic, Alex Teixeira’s article provides valuable information.
The search then executes the constructed queries and collects the resulting data into a designated summary index for dashboard consumption and retrospective searches.
Next, it enriches the collected data by getting additional details from the KV store (such as description, owner, suppress), which are not returned by the tstats search.
After processing and aggregating the enriched data, the search updates the KV store entries with the latest event time and index time for each log source. This ensures that the KV store maintains current information about every log source.

Alert Search for Monitoring Log Source Integrity
The query shown below monitors log source integrity using data from the critical_indexes_kv lookup table. It identifies indexing issues by comparing actual log data against predefined thresholds and current time.
Key Steps in the Search Process:
Retrieve and Filter Data:
• Input Lookup: The search retrieves entries from critical_indexes_kv, focusing only on log sources that are not suppressed (suppress!=1).
Calculate Thresholds and Delays:
• Index Threshold: Calculated as the current time minus the index_threshold (in seconds), representing the maximum allowable age for last_index_time.
• Delay Threshold: Converted from minutes to seconds, it defines the maximum acceptable delay between an event’s occurrence and its indexing.
• Indexing Delay: The difference between last_index_time and last_event_time, indicating any latency in indexing.
Handle Missing Data:
• Null Handling: last_index_time is set to zero if null, ensuring that missing data does not disrupt calculations.
Format Alert Messages:
• Formatted Index Time: Indicates if events have not been indexed or shows the last known index time.
• Formatted Indexing Delay: Shows the delay in indexing in minutes, rounded for clarity.
Determine Alert Reason:
• Case Evaluation: Uses a case statement to set alert_reason based on whether thresholds are exceeded. Defaults to “No issues detected” if no problems are found.
Filter and Output Alerts:
• Filter Non-Issues: Excludes entries with no issues, focusing on problematic log sources.
• Output Table: Displays relevant details, such as alert_reason, thresholds, and log source metadata, to facilitate issue resolution.
This alert mechanism ensures that any anomalies or delays in log processing are promptly detected, allowing for swift intervention and helping maintain the reliability and integrity of log data within Splunk.
To enhance responsiveness, an alert action can be configured to send email notifications to the relevant log owners or detection engineering teams whenever there is an issue with some of the log sources.

The alert search and sample results
Dashboard for Monitoring Log Source Integrity
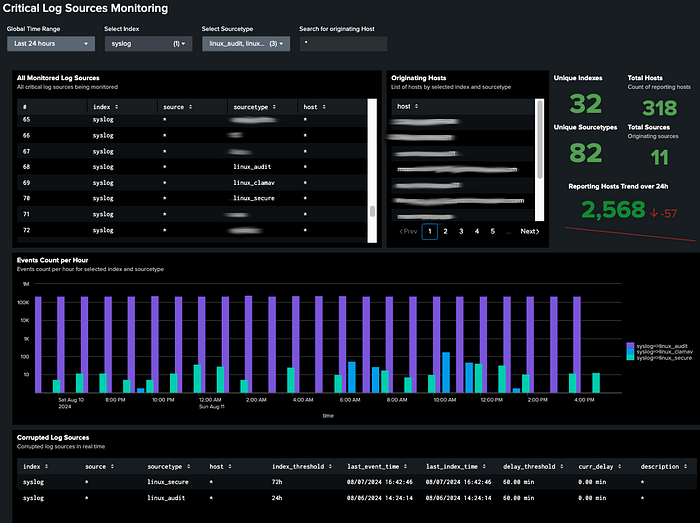
The accompanying dashboard provides a comprehensive view of log source integrity, leveraging data from the KV store and summary index. It allows users to monitor and analyze critical log sources.
Key Features of the Dashboard:
• Overview Table: Displays all monitored log sources, allowing filtering by index, sourcetype, and originating hostname.
• Log Source Details: Lists unique hosts sending logs to Splunk and details unique indexes, sourcetypes, sources, and hosts.
• Event Count Visualization: A bar chart visualizes event counts per hour, categorized by index and sourcetype.
• Current Issues Table: Highlights log sources with indexing delays or missing logs, providing essential details for resolution.

Closing Thoughts
Maintaining the integrity of our log sources is crucial for reliable threat detection with Splunk.
The framework we’ve discussed — encompassing the KV store, summary indexing, and dynamic searches for KV store generation and alerting — provides a powerful solution to tracking log sources and addressing issues such as delays and missing logs.
By implementing this framework, you can ensure that your log data remains accurate and reliable, which is essential for a timely and effective response to potential issues.
If you have any questions about the technical details or need guidance on implementing these solutions, don’t hesitate to reach out to me on LinkedIn. I’m here to help and would be glad to assist you in making your log monitoring as efficient as possible.


